Customer segmentation is a powerful tool to help businesses focus their efforts on the right people and serve customers better. A customer segment is a grouping of customers that share certain characteristics; they help you understand how customers differ and how you can adapt to the differences.
What are the benefits of segmenting customers?
Identifying your most profitable customers. Businesses will want to identify the groups of customers who are the most likely to spend money with them. It will be worth spending more money to acquire or retain customers who belong to these segments versus those in less profitable groups.
On the other hand it can also identify groups of customers which aren’t engaging with your business as well as you’d hoped. If you understand the characteristics of those customers, you can develop a strategy to target them.
Tailoring marketing campaigns. In the past all customers would be exposed to the same marketing materials, whether through advertising in print media, leaflets, billboards or broadcast media. A business only had to identify characteristics which most of their target audience shared and blast the same message out at them whilst accepting the fact that many potential customers might be put off.
The great power of digital and social media advertising is that different customers can see messages specifically tailored towards them. Dividing your customers into meaningful segments is essential to take advantage of this.
Customising products or service features for different groups. Just as marketing can be tailored to different audiences, some products and services can also be customised to different customers.
Predicting future purchase patterns or behaviour. Finding out how different segments are likely to behave is useful for a number of reasons.
It can help identify and target individual customers who are behaving unusually in relation to their segment, so for example one group of customers might tend to purchase every week, whereas another might purchase every month. If a customer from the first group hasn’t bought anything for two weeks then this would be flagged as unusual and might trigger a special offer being sent to them. But for customers in the second group, not purchasing for a fortnight would be perfectly normal behaviour and not trigger any special action.
It can also be used to recommend products – if one segment tends to purchase a lot of a particular product, you can identify customers who don’t currently purchase that product and offer them a recommendation.

How to segment your customers
Segmenting by Demographics
There are lots of different ways of dividing up customers. If you have access to demographic data about your customers then dividing them into groups based on this data is an obvious way to segment them. Demographic data usually consists of variables such as gender, age, income, education, occupation and number of children.
Businesses will almost always have data on where customers live or where their business is based (if they are in the B2B market). There is a huge amount of official government data about the characteristics of different geographical areas which can help inform a business about the sorts of customers who are likely to live there.
Segmenting by Behaviour
The other way to divide customers is not by who they are, but by what they do. This can include an analysis of their transactions with the business, but also factors such as when they shop (is it at a particular time of year or time of day), what channels do they use to shop (online or in store), what type of products do they buy, do they have a loyalty card, and any information about social media activity that your business holds.
Segmentation by RFM
RFM (recency, frequency, monetary) analysis is a popular way of segmenting customers which examines how recently a customer has purchased (recency), how often they purchase (frequency), and how much the customer spends or how much profit they generate (monetary), to find out who are your best customers.
The advantage of using this methodology over just looking at how much each customer has spent, is that it takes into account the fact that a customer who made one large purchase a long time ago, is probably not as valuable as a customer who has made smaller and more frequent purchases very recently. It also suggests different actions which could be taken to deal with each segment.
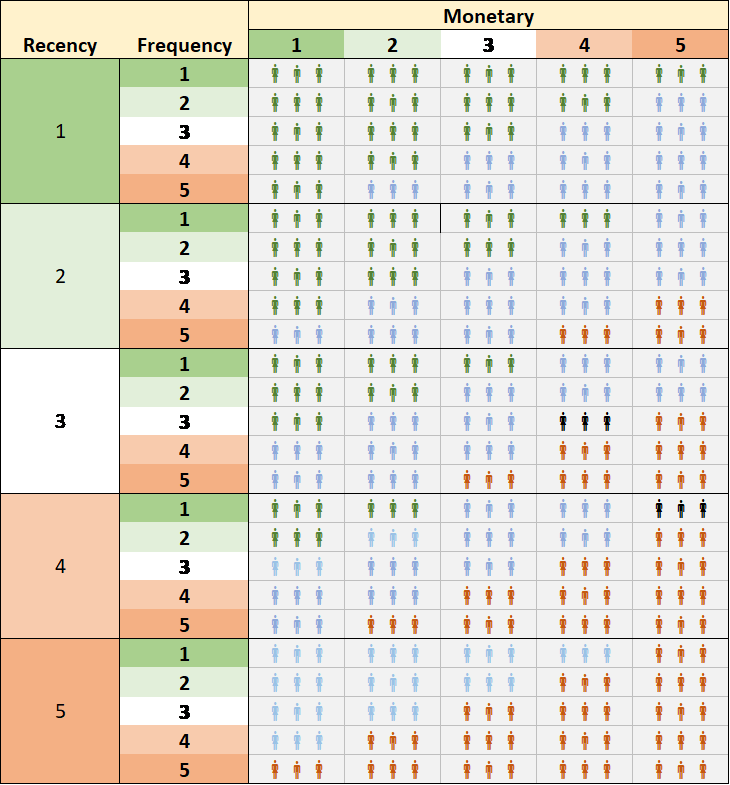
RFM works by dividing customers into five equal groups for each measure (sometimes only four groups are used). Customers that have purchased the most recently would go into group 1, customers that have purchased a very long time ago would go into group 5 – similarly for frequency and monetary value, the most frequent and highest spending customers would go into group 1.
This produces a grid like this:

This means you can (for example) identify customers which are in high groups for frequency and monetary, but which haven’t bought recently – so this group could be targeted with personalised emails to encourage them to reconnect with the business. On the other hand customers which have bought recently and frequently but do not have high monetary value could be encouraged to trade up to higher value products.
Segmentation using Clustering techniques
RFM is undoubtedly a useful tool, but it doesn’t tell you anything about customers other than their value to your business, and it can’t help with other objectives such as designing targeted marketing campaigns.
This is where clustering techniques come in – these can draw on all types of data such as demographics, geographical location, time of purchase, which channel was used to purchase etc.
Clustering is used to find groups of observations that share similar characteristics, so you should end up with clusters where customers in the same cluster are more similar to each other than customers in a different cluster. The goal is to obtain customers in the same group as similar as possible, and customers in different groups as dissimilar as possible.
There are lots of different ways of clustering data. Some are highly complex and involve machine learning techniques which can be very opaque with businesses having little understanding of how the clusters were created. But the good news is that two of the most common clustering techniques are relatively simple and can be calculated using an add-in to Excel.
Hierarchical clustering starts off by treating each data point as a separate cluster and then starts merging the clusters which are most similar until all the data points are merged into a single cluster. The output is a diagram known as a “dendrogram” (from the Greek word dentro meaning tree), showing how the algorithm carried out its merging process.
In this example there are six data points – the ones which split closest to the bottom (C6 and C1, plus C2 and C5 in the diagram below) are the most similar to each other.

It’s up to the analyst to decide where to cut the branches, which determines how many clusters you end up with. In the chart below cutting the branches at Point A would give two clusters, cutting them at Point B would give 4 clusters and not cutting the branches at all would result in the six data points we started off with. In this case, because C6 and C1 are so similar, and C2 and C5 are also very similar, the decision would probably be taken to merge those data points and have at most four clusters in total.
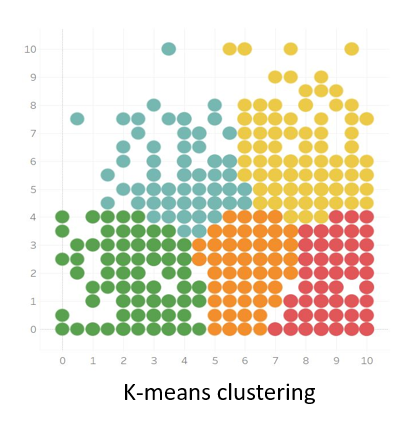
K-means clustering starts off with the analyst deciding how many clusters they want to end up with (in the example below, five clusters have been chosen). An algorithm would then select five random points to act as the centre points of the clusters (a “centroid”), and assign each data point to the nearest centroid. It then makes several passes back through the data moving the centroids to make sure the distance between the points in each cluster is minimised.
The graph below shows the results of the clustering (each cluster has a different colour), but it only looks at two variables so the clustering is obvious. The power of K-means is that it could be used to find clusters using many different variables that a two dimensional graph could not capture.

One of the disadvantages of K-means is that the analyst does not know in advance how many clusters the data should be divided into. In practice you usually have to have several goes at clustering with different numbers of starting clusters, plot the results on a graph and find what’s known as an “Elbow point” to make a final decision.
How to get the best out of clustering
Clustering is an open-ended technique. When you start off you have no idea what groupings you might find, and some of them may come as a complete surprise. So you need to start off with an open mind and be prepared to abandon pre-conceived ideas about your customers if the data shows they aren’t correct.
At the same time, you need to be clear about what you are ultimately trying to achieve. Are you trying to improve your marketing targeting? Or are you trying to change purchasing behaviour, or is there another metric you are interested in?
If your clusters are useful then you should start seeing patterns in the way that customers behave in relation to your chosen goal. So, for example, if your aim is to run differentiated marketing campaigns then you should see differences between the clusters in their response to marketing campaigns you have run in the past. Or if you want to increase frequency of purchase, you would want your clusters to have varying levels of frequency, so you could look at the characteristics of the low frequency clusters and therefore what might encourage them to buy more often.
Conclusion
Customer segmentation does not have to be a hugely expensive or complex process, and can often be carried out using data a business already holds. It is, however, an essential tool in understanding your customers and making sure that you don’t waste time and effort targeting the wrong people.
This graph shows that in fact there is very little relationship between a customer giving a high Customer Service score and giving a high NPS score. The R2 value is 0.001 meaning that only 0.1% of the changes in the NPS score can be attributed to changes in the Customer Service score.
When we look at the relationships between Speed and NPS, and Quality and NPS, the correlation is much stronger.
Get in touch
If you believe that evidence-based decision making is driven through collaboration between analysts and business managers then contact us to talk about how your business uses data, and find out whether there is a fit between your needs and the services Sensible Analytics can offer.
