

Commercial and analytical
My unusual combination of a commercial background with analytical skills gives me both a great understanding of what businesses want to achieve and the technical ability to help them realise useful and realistic objectives.
My background
I am a Cambridge graduate with 15 years experience of working as a commercial analyst for some of the best known retailers and FMCG firms in the UK, including 13 years working for Marks & Spencer. For my full CV please click here
I want to help businesses make better, evidence-based decisions using data.I founded Sensible Analytics because I really believe that data analytics can benefit all businesses, whatever their size.
Why did I want to be a data analyst?
There is (almost) nothing that beats the excitement of exploring data and finding out something that no one else knew before.
A software package can crunch through data and throw out all the statistically significant relationships within a dataset, but the challenge of being a data analyst is to distinguish whether what you've found out is important, interesting or relevant. This is something only a human with experience and critical thinking skills can do.
Meanwhile the complexities of navigating different stakeholders' interests, whilst taking into account the circumstances of each particular business plus the external market environment is what makes the job of a data analyst so complex, so varied and so rewarding. No two days are ever the same.
Data is not just useful it's beautiful!
With data becoming so important to every area of business, the need to communicate data insights to non-technical audiences becomes more and more important. If you cannot communicate your messages in a way that allows managers and others in your business to act on them, then finding those insights was pointless.
People find it much easier to absorb information when it is presented in a visual format , which is why we create graphs, dashboards and presentations rather than present rows and rows of figures. But the wrong choice of graph, or a poorly designed dashboard can be confusing and could lead to managers drawing false conclusions and then making the wrong decisions.
Like most people I think in a visual way, which is why I hugely enjoy designing visualisations and presentations which are right for the data and clear for the audience.
Technical skills
I have used Excel for most of my working life, and am very comfortable with using it at an advanced level. But for very large datasets, Excel is not always an appropriate tool. I also have extensive experience with SQL (Structured Query Language) which can be used to extract and manipulate datasets with billions of rows (for example at Marks & Spencer I was dealing with transaction level data which contained details of every single transaction which passed through a till).
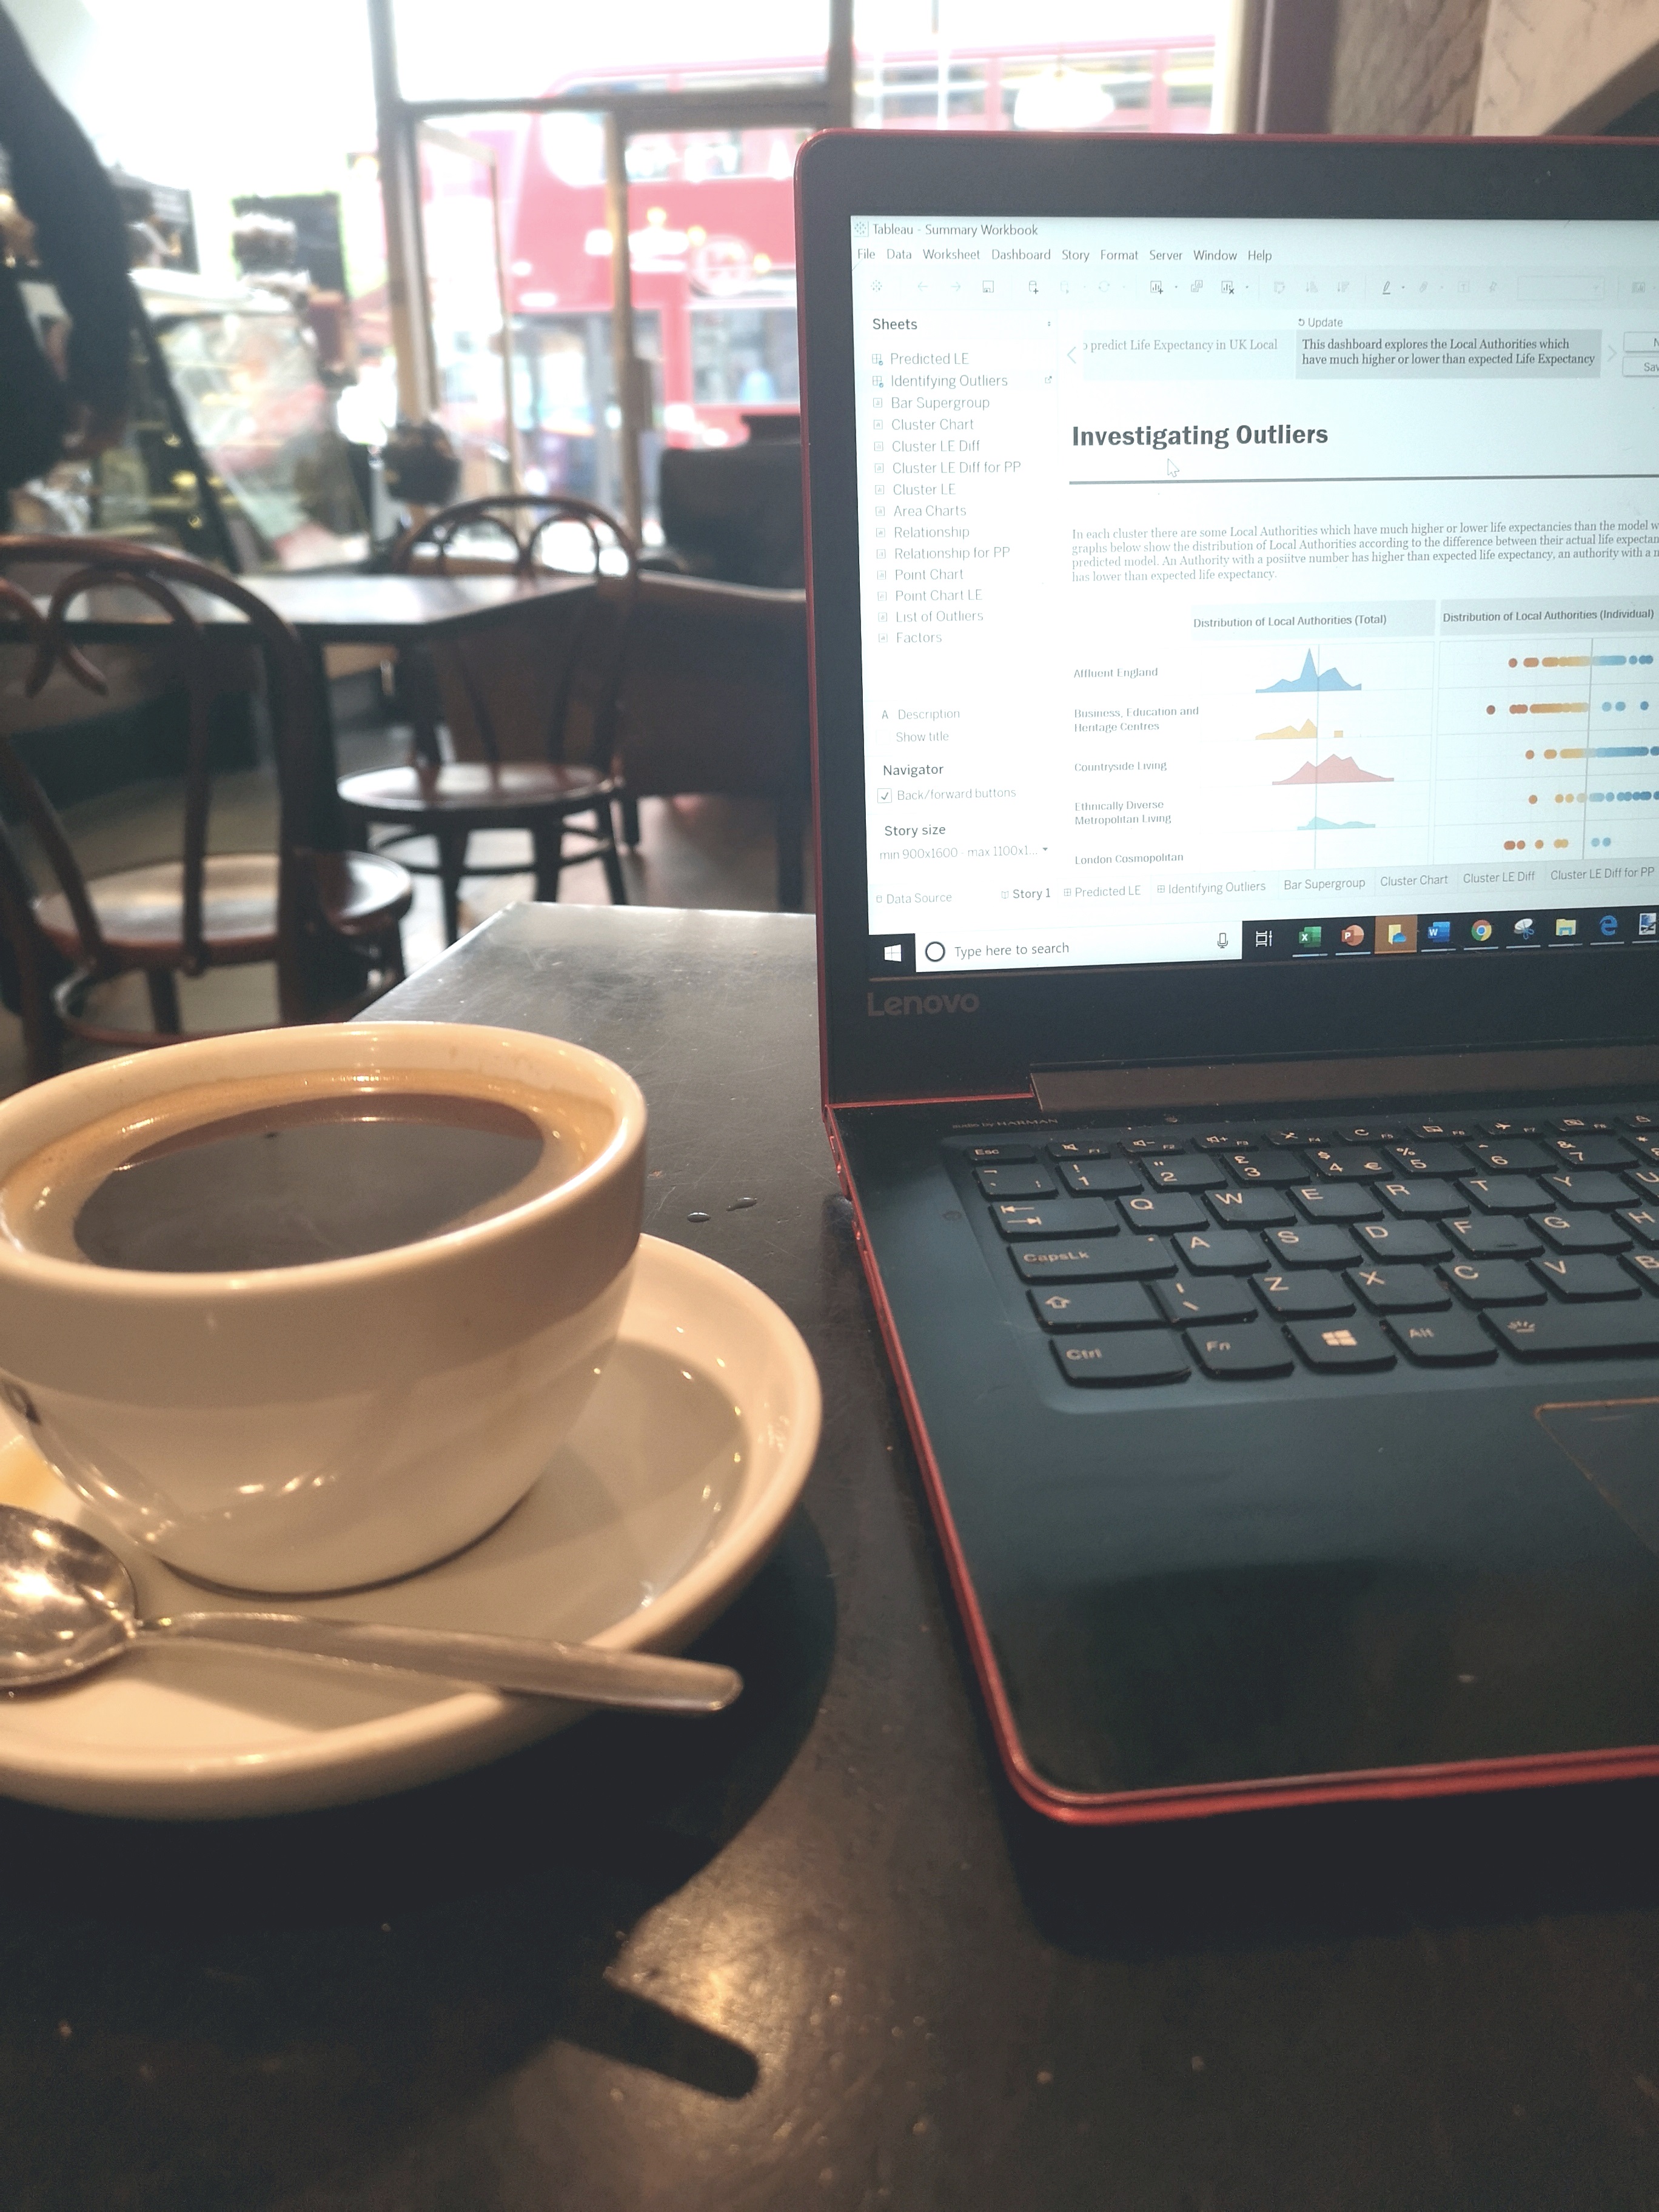
When presenting data, Excel can create some surprisingly attractive dashboards but Tableau allows data presentation to be taken to the next level, and can create stunning visualisations (see my Portfolio for examples of both Excel and Tableau dashboards). Tableau can also draw data directly from SQL so that a dashboard can be automatically refreshed with (for example) new sales data every day or every week.
Values
There is no point in analysing data if you are not going to be honest about the results. Sometimes the outcomes are not what you expected or wanted. Sometimes the data doesn't say anything new or insightful. Manipulating or ignoring results leads to poor decisions being made and I won't do it. Ever.


